In the manufacturing industry, ensuring consistent product quality is crucial for the success of any business. One effective tool that businesses can use to monitor and analyze variations in their manufacturing process over time is a product quality control chart.
This graphical tool allows businesses to identify potential quality issues early on by visually detecting when a process deviates from its established control limits. By doing so, businesses can take corrective actions promptly and maintain consistent product quality, ultimately ensuring customer satisfaction.
What is a Product Quality Control Chart?
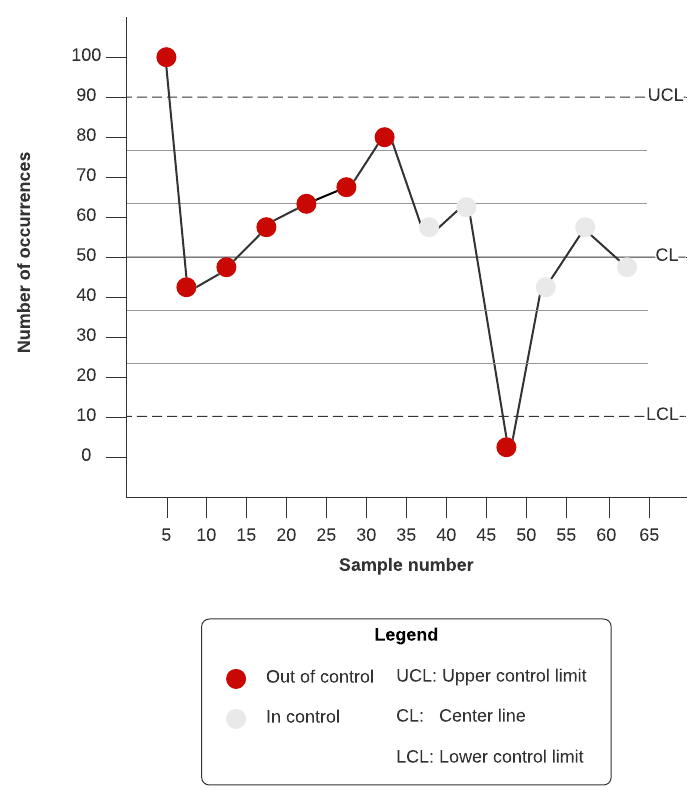
A product quality control chart is a graphical tool used to monitor and analyze variations in a manufacturing process over time. It consists of a chart with control limits that represent the acceptable range of variation for a particular process. The chart also includes data points that are plotted over time, allowing businesses to visually track the performance of their manufacturing process.
By using a product quality control chart, businesses can easily identify when a process deviates from its established control limits. This serves as an early warning system, enabling businesses to take corrective actions to prevent defects and ensure consistent product quality.
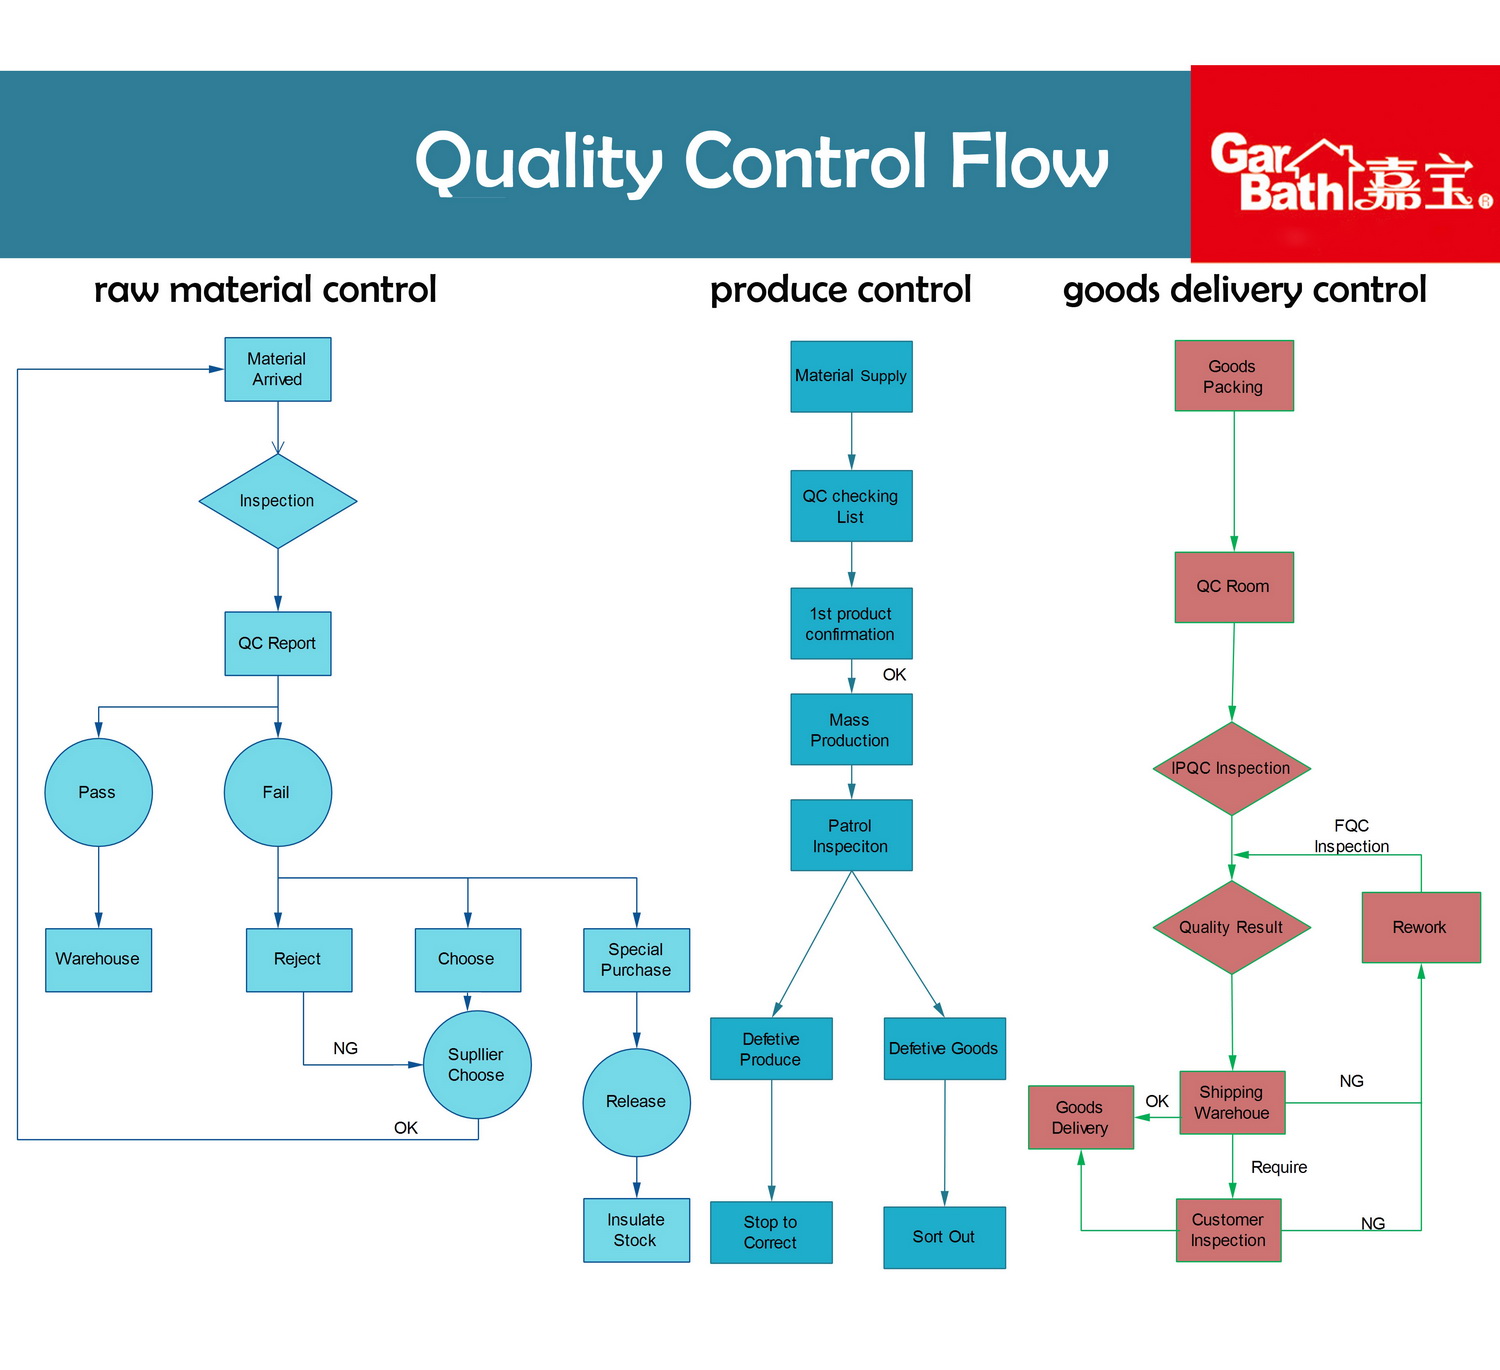
Why is a Product Quality Control Chart Important?
A product quality control chart is an essential tool for businesses in the manufacturing industry.
Here are some reasons why it is important:
- Early Detection of Quality Issues: By visually detecting when a process deviates from its established control limits, businesses can identify potential quality issues early on. This allows them to take corrective actions promptly and prevent defects from occurring.
- Maintaining Consistent Product Quality: By monitoring and analyzing variations in the manufacturing process, businesses can ensure that their products meet the desired quality standards consistently. This helps in building a reputation for delivering high-quality products.
- Preventing Customer Dissatisfaction: By using a product quality control chart, businesses can prevent defects that may lead to customer dissatisfaction. Ensuring consistent product quality is crucial for maintaining customer trust and loyalty.
- Improving Overall Efficiency: By analyzing the data points on the quality control chart, businesses can identify areas of improvement in their manufacturing process. This allows them to implement changes that can lead to increased efficiency and reduced waste.
How to Create a Product Quality Control Chart?
Creating a product quality control chart is a relatively straightforward process. Here is a step-by-step guide:
- Gather Data: Collect data on the performance of your manufacturing process over a specific period. This data can include measurements, observations, or test results.
- Establish Control Limits: Determine the acceptable range of variation for your manufacturing process. These control limits will serve as the boundaries on your quality control chart.
- Plot Data Points: Plot the data points on the quality control chart, with time on the x-axis and the measurement or observation on the y-axis. Connect the data points with a line.
- Calculate Central Line: Calculate the central line on the quality control chart, which represents the average or target value for the measurement or observation.
- Monitor and Analyze: Continuously monitor and analyze the data points on the quality control chart. Look for any trends, patterns, or deviations from the control limits.
- Take Corrective Actions: If you identify any deviations from the control limits, take prompt corrective actions to address the issues. This can involve adjusting the manufacturing process, conducting further inspections, or making changes to equipment or materials.
- Update the Chart: Regularly update the quality control chart with new data points to track the performance of your manufacturing process over time.
Examples
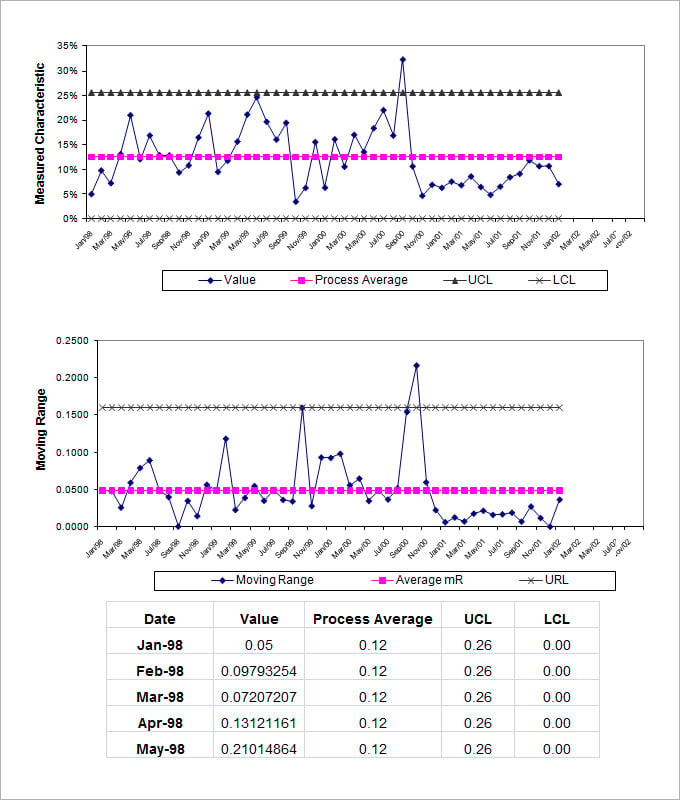
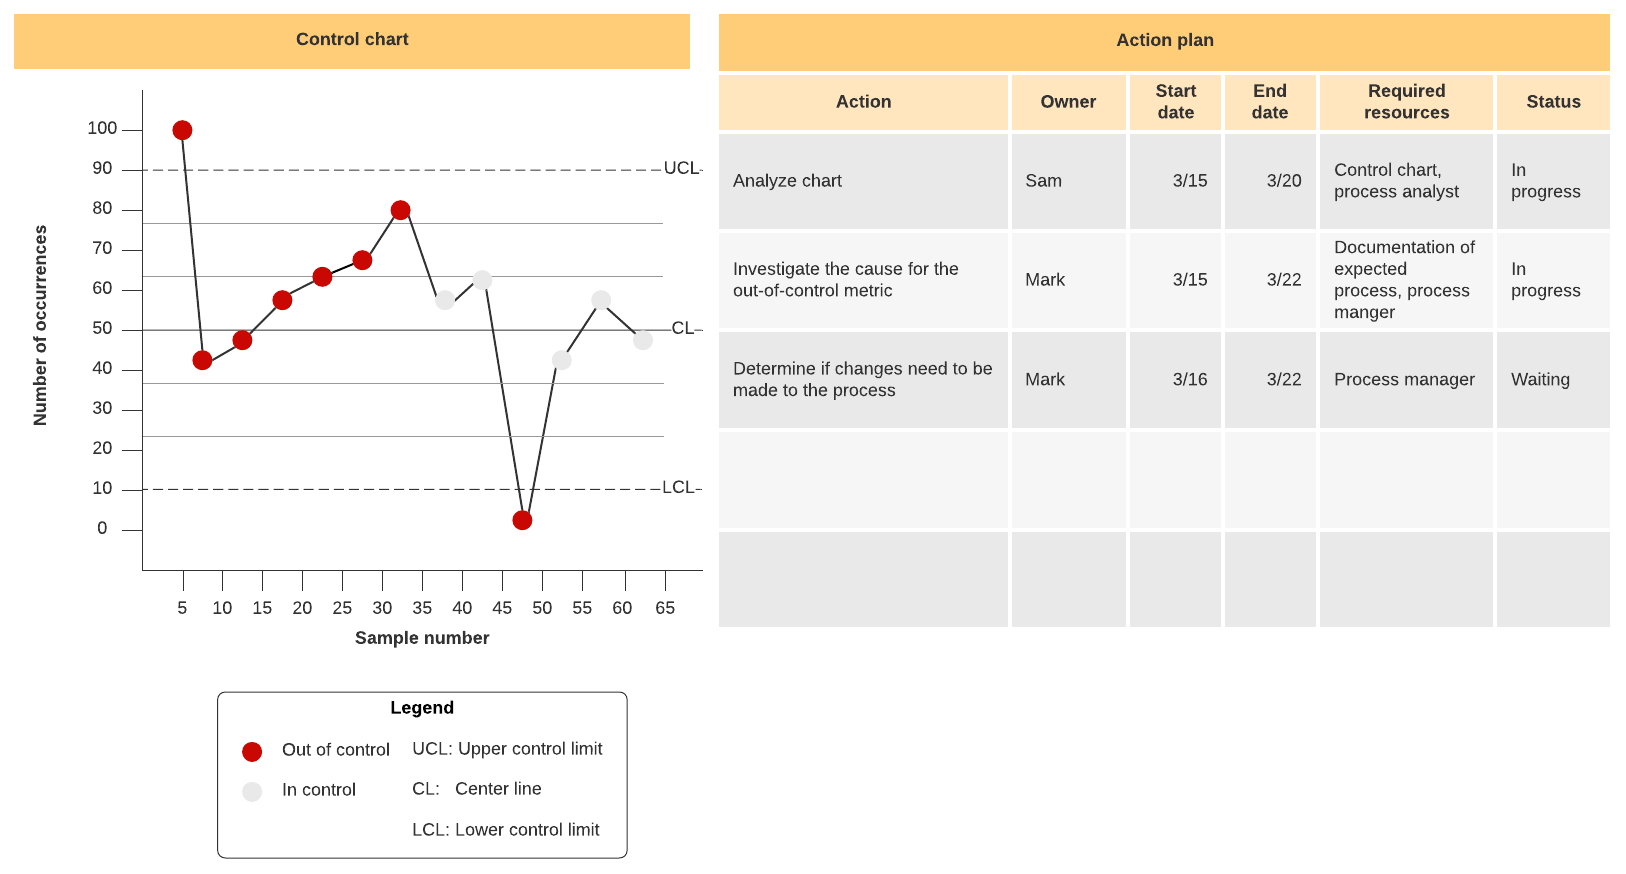
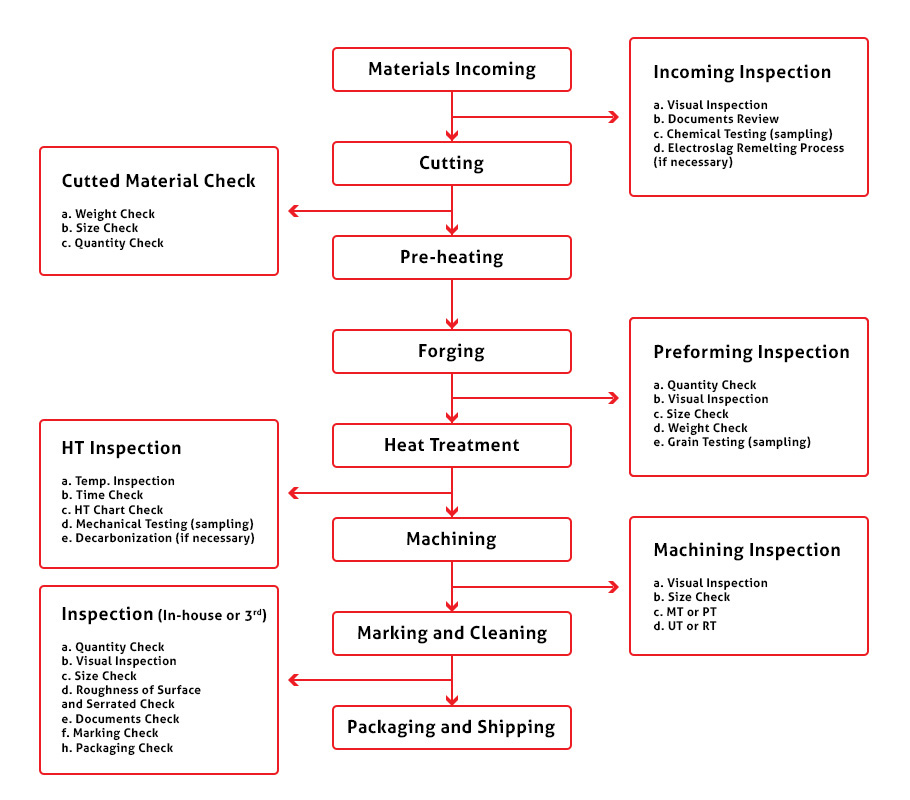
Tips for Successful Use of a Product Quality Control Chart
To ensure successful use of a product quality control chart, consider the following tips:
- Collect Sufficient Data: Ensure that you have enough data points to accurately analyze the performance of your manufacturing process. The more data you have, the more reliable your conclusions will be.
- Regularly Update the Chart: Update the quality control chart regularly with new data points to track the performance of your manufacturing process over time. This will help you identify any long-term trends or changes.
- Train Employees: Provide training to your employees on how to use and interpret the quality control chart. This will ensure that everyone understands its purpose and can contribute to maintaining consistent product quality.
- Implement Continuous Improvement: Use the insights from the quality control chart to implement continuous improvement in your manufacturing process. Identify areas for optimization and make necessary changes to enhance efficiency and quality.
Conclusion
A product quality control chart is a powerful tool that businesses can use to monitor and analyze variations in their manufacturing process over time. By visually detecting when a process deviates from its established control limits, businesses can identify potential quality issues early on and take corrective actions promptly. This helps in maintaining consistent product quality, preventing defects, and ensuring customer satisfaction.
By following the steps outlined in this article and considering the tips provided, businesses can effectively utilize a product quality control chart to enhance their manufacturing process and deliver high-quality products consistently.
Product Quality Control Chart Template – Download